Miscellaneous global energy data, 2010 to 2016
From my old posts:
1. Estimated generation cost of various power sources in the US.

Source: http://www.eia.gov/forecasts/aeo/electricity_generation.cfm
Reposted with discussion by Willis Eschenbach, The Dark Future of Solar Electricity, December 03, 2011.
2. Asia energy rates, 2010.

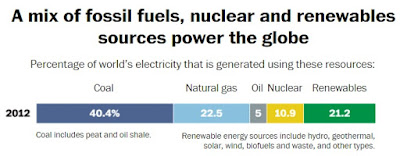
3. World energy mix, 2010. Wind and solar contributed only 0.5 percent and 0.06 percent respectively, to global energy consumption.

Source: Total world energy consumption by source 2010, from REN21 Renewables 2012 Global Status Report.
Reposted in WUWT, A LOL ! press release on renewable energy from wishful thinkers at the University of Delaware
4. Germany energy mix, 1990 to 2011, capacity utilization for (a) wind about 15%, (b) solar about 10%. The other renewables have higher utilization rate.

source: NTZ, Germany’s Renewable Energy Efficiency Falls To Just Over 20% – Threatening To Ruin Country’s Competitiveness, February 24, 2013
The author, Pierre Gosselin, added,
Call it communist power management. In the communist days it took 10 men to the job of one man in a free market. On the energy market, it takes 5 green generators to do the job of a single conventional generator.5. Germany, early 2013. Wind power there has an installed cap of 31,300 MW, but actual power generated was only 1,479, or only 4.7 percent.
Little wonder that Environment Minister Peter Altmaier says Germany’s transition to green energy is going to cost $1.3 TRILLION dollars if the madness isn’t stopped soon.

source: NTZ, Germany’s Wind Performance Was Just As Bad As Great Britain’s – Sun And Wind Are Often AWOL! March 04, 2013
6. US cost of by energy source 2010: break-even: (a) offshore wind 34, (b) solar thermal 26, (c) solar photovoltaic 16, (d) advance coal with CCS 14, ... conventional coal 10, natural gas 6-7,

source: WUWT, Maryland’s “Wind Powered Welfare”, March 12, 2013


Comments
Post a Comment